When the Streak Runs Out

EXECUTIVE SUMMARY
In the final week of May 2026 the S&P 500 registered its ninth consecutive weekly advance, an exceptionally long run by any historical standard. Our analysis of weekly winning streaks since 2016 carried a clear message into that close: the odds of the index assembling a tenth straight weekly gain were vanishingly small. Across the trailing 545 weeks, exactly one such streak ever reached ten weeks, and none ever reached eleven. On that basis we made a deliberate decision to reduce gross exposure and position for softness in June, a view we placed on the public record on May 29, while the streak was still intact. In the week that followed, the index fell 2.6%, a single weekly decline that erased more than the entire advance of the preceding three weeks and confirmed the path the base rates had favored. This brief sets out the evidence behind that call, the statistical reasoning that drove it, and what it implies for positioning through the balance of the quarter.
The Setup: A Ninth Consecutive Weekly Gain
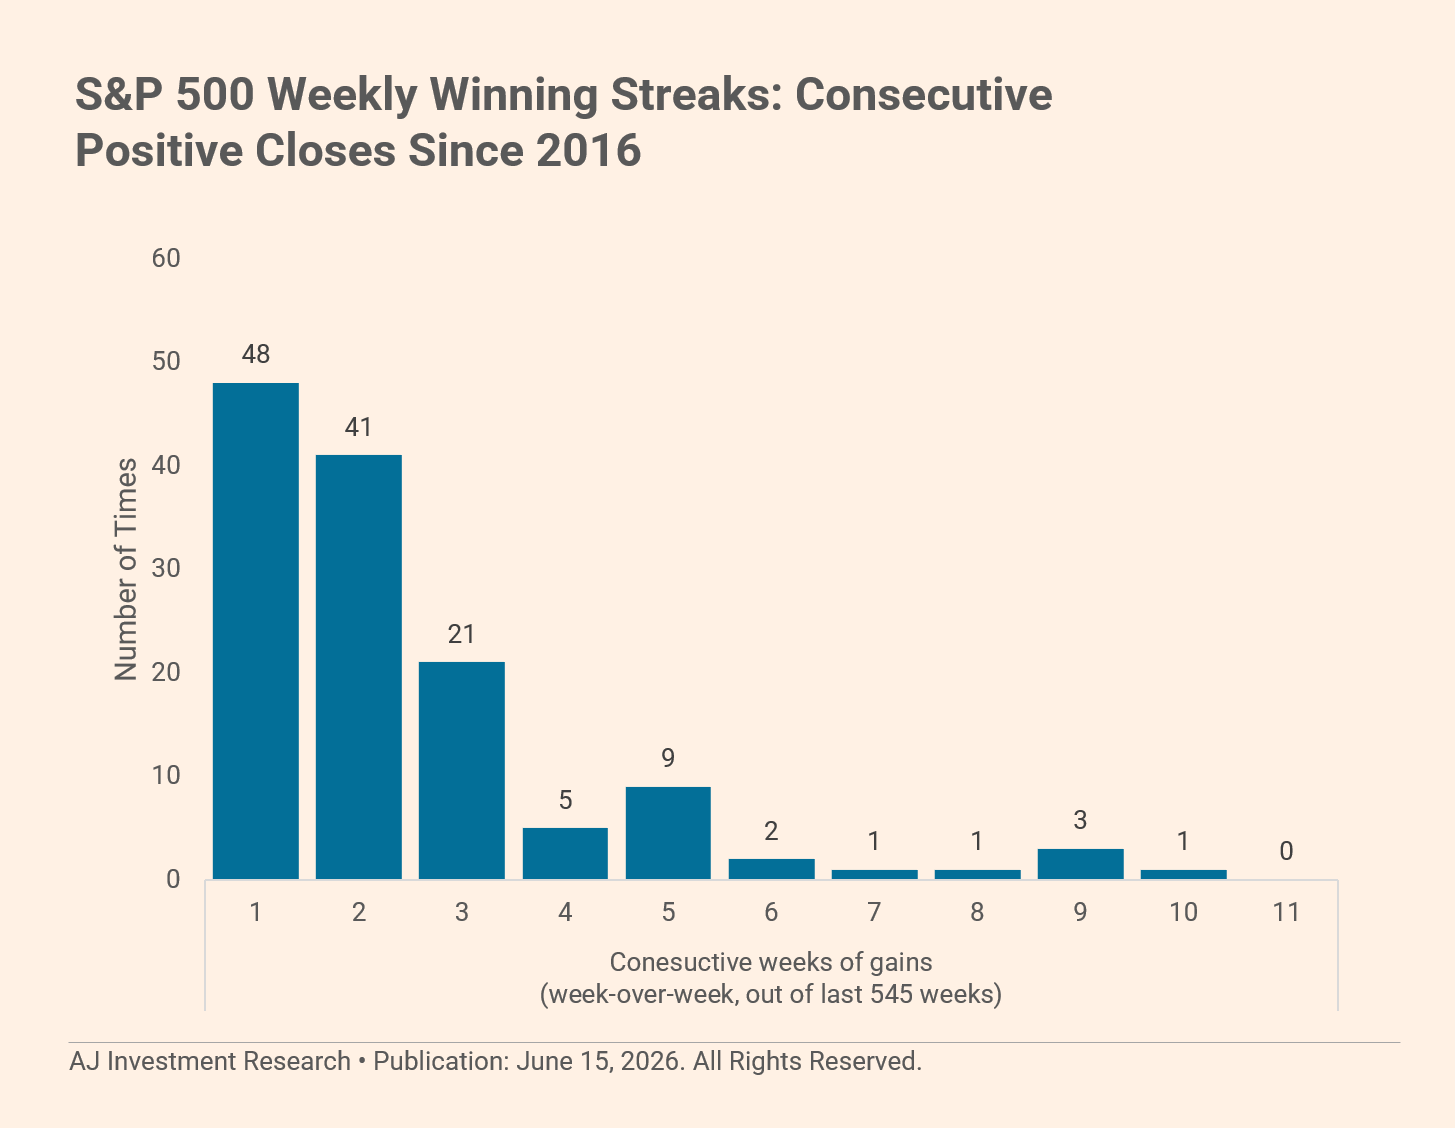
By late May the S&P 500 had closed higher for nine weeks in a row. Streaks of that length are not merely uncommon; they sit in the extreme tail of the historical distribution. To frame just how unusual the situation had become, we examined every weekly winning streak in the index across the trailing 545 weeks, a window that reaches back to 2016. The result, shown in Exhibit 1, is a distribution that decays sharply as streak length grows. Short runs are routine. Long runs are scarce. Runs of nine weeks or more are rare enough to count on one hand.
Exhibit 1. S&P 500 weekly winning streaks since 2016. Counts reflect the number of distinct streaks of each length observed over the trailing 545 weeks.
The Statistical Case Against a Tenth Week
The shape of the distribution is the entire argument. Of the 132 distinct winning streaks recorded since 2016, the overwhelming majority resolved within one to three weeks. By the time a streak reaches nine weeks it has already entered territory visited only four times in the entire sample. Of those four occasions, just one progressed to a tenth consecutive week, and not a single streak in the record has ever survived into an eleventh.
The implications are stark, and they cut in one direction. The key figures from the distribution are summarized below:
• Only one ten week winning streak has occurred in the past 545 weeks, a single instance in more than a decade of data.
• No streak has ever extended to eleven consecutive weeks across the entire sample.
• A streak that reaches nine weeks has historically failed to extend to a tenth in three of every four instances.
• Since 2020 the index has not produced a single run of ten or more consecutive positive weekly closes.
Read together, these numbers describe a market sitting at one of the most stretched points it can reach on this particular measure. We do not treat any single statistic as destiny. But when an asset arrives at a configuration that has resolved unfavorably in roughly three of every four prior instances, and has only once in a decade resolved the other way, the asymmetry is too large to ignore. The prudent response was not to chase the tenth week but to prepare for its absence.
The Public Record: Our Call Before the Turn
We are mindful that conviction expressed after the fact is worth little. For that reason we documented our positioning publicly while the streak was still intact. On May 29, as the ninth weekly gain was being completed, we stated plainly that we were deleveraging and positioning for slight weakness in June, and we cited the precise statistical basis: since 2020 the index had not delivered a single run of ten or more consecutive positive weekly closes. That post is reproduced in Exhibit 2.
Exhibit 2. AJ Investment Research public commentary, May 29, 2026.
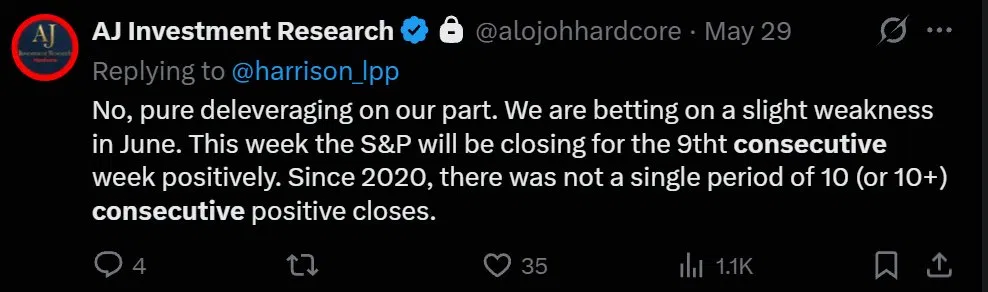
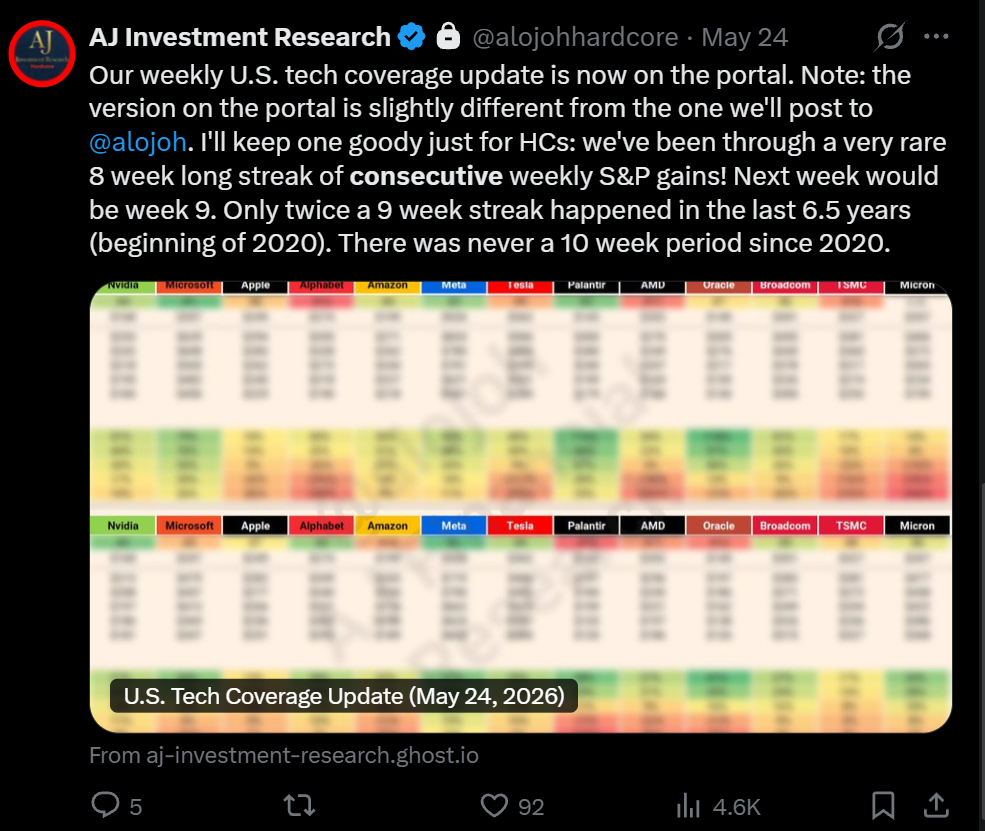
Exhibit 3. AJ Investment Research first public warning, May 24, 2026.
The note was not a hedge or a vague expression of caution. It named the mechanism, the timing, and the action. The streak then broke. In the very next week the S&P 500 declined 2.6%, a move that wiped out approximately the gains accumulated over the prior three weeks and returned the index toward where it had traded in early May. The outcome was consistent with the base rate we had identified. We highlight this not to claim foresight beyond what the data supported, but to underscore a discipline we regard as central to the firm: when the evidence is clear, we say so in advance and we trade accordingly.
Positioning and Implications
Our response to the setup was a measured reduction in gross exposure rather than an outright short. The distinction matters. The statistical edge here concerns the low odds of continuation, not a forecast of a violent decline. A streak ending is, in the typical case, a pause or a modest pullback rather than the onset of a sustained drawdown. We therefore favored deleveraging, raising cash, and trimming the most extended positions over any aggressive directional wager against the market. The 2.6% setback that arrived in the following week sat squarely within that expectation: meaningful enough to reward the caution, contained enough to validate the choice of leverage reduction over an aggressive short.
For investors who carried elevated exposure built up through the run, the same logic applies. The probability that the advance simply continued at the same cadence was low. Rebalancing toward target weights, taking profits in the names that had moved furthest, and rebuilding optionality for a softer June represented a sensible use of the signal. Capital preserved at a statistical extreme is capital available to redeploy once the distribution of outcomes resets toward more favorable odds.
Risks to the View
Intellectual honesty requires that we state where this thesis can fail. Base rates describe frequencies, not certainties. The single instance of a ten week streak in our sample is a reminder that the tail outcome does occur. A powerful macro catalyst, a decisive shift in monetary policy expectations, or a continuation of the momentum that drove the initial nine weeks could each extend an advance beyond what the historical distribution would predict. A sample drawn from one regime may also understate the persistence achievable in another. We size positions with these possibilities firmly in mind, which is precisely why our expression of the view was a reduction in leverage rather than a concentrated bet. The aim is to be paid for the high probability outcome while surviving comfortably if the low probability one arrives instead.
Conclusion
The S&P 500 reached a genuinely rare milestone in late May with its ninth consecutive weekly gain, and the historical record offered an unambiguous read on what tends to follow. Ten week streaks are close to nonexistent, eleven week streaks are unprecedented in the sample, and the conditional odds of extending from nine weeks to ten have favored the bears by roughly three to one. We acted on that evidence before the fact, communicated it openly, and positioned the book for the more probable path. The streak broke as the statistics suggested it would, and it broke with conviction: the very next week delivered a decline of 2.6% that surrendered close to three weeks of accumulated gains. We continue to favor disciplined exposure management through the balance of June and will revisit the stance as the distribution of outcomes normalizes.